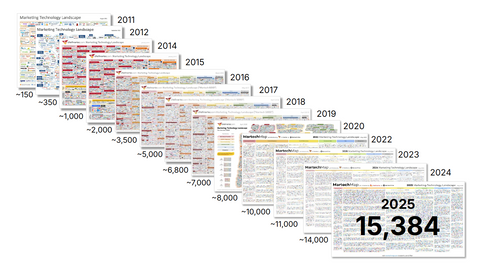
Data-driven management has become a strategic reflex. SaaS companies are multiplying their tracking tools, dashboards, and KPIs. Yet behind this apparent mastery of metrics often lie significant analytical biases that can distort decision-making.
Most analysis mistakes do not stem from a lack of data, but from misinterpreting the data already available.
This article outlines the three most common data analysis errors observed in SaaS companies, and most importantly, how to anticipate and avoid them.
1. Forgetting That Every SaaS Tool Speaks Its Own Language
A metric is never universal.
The first mistake is to treat a metric as an absolute truth. In reality, every SaaS tool has its own logic and way of calculating and presenting data.
Take churn rate, for example. Depending on the tool, it might be calculated based on:
-
The number of closed accounts
-
Lost Monthly Recurring Revenue (MRR)
-
Including or excluding upgrades and downgrades
Another example is the notion of an "active user":
-
Some tools define it as a login within the past 30 days
-
Others require a specific in-app action
-
Some even include anonymous sessions
The result: inconsistent and incomparable figures, leading to decisions based on an illusion of precision.
Risks associated with this error include:
-
Comparing metrics from different tools without standardization
-
Taking automated dashboards at face value
-
Underestimating or overestimating performance
Best practices to avoid this bias:
-
Clearly document the definitions of key metrics used
-
Standardize calculation rules across tools or centralize data in a managed data warehouse
-
Implement a shared data glossary across all teams (Marketing, Sales, Product, Finance)
-
Train teams to critically interpret dashboards and question reported figures
Tip:
Conduct an audit of your analytics tools and their calculation methods to identify inconsistencies and areas of ambiguity.
2. Comparing Data from Different Periods: The Trap of Instant vs. Long-Term
Another frequent mistake is comparing data from different periods without accounting for business cycles, context, or timing.
Examples include:
-
Comparing traffic data just after a product launch to that of a quieter period
-
Evaluating the conversion rate of an email campaign over 24 hours when customer behavior usually spans 7 days
-
Measuring SaaS usage in a month when a major update was deployed, without accounting for that event
In SaaS, where adoption, retention, and conversion cycles are often long and non-linear, these temporal biases can be highly misleading.
Risks include:
-
Drawing incorrect conclusions from micro-samples
-
Making hasty decisions such as pivoting or discontinuing a feature
-
Misinterpreting isolated spikes or drops
Best practices to avoid this bias:
-
Always specify the analysis period for each metric
-
Standardize analysis periods based on business cycles (monthly, quarterly, cohorts)
-
Use internal benchmarks consolidated over time (e.g., trend curves, cohorts, rolling averages)
-
Compare variations against comparable periods rather than raw numbers
Tip:
Implement dashboards with standard, predefined timeframes for analysis, validated by your data team or CFO.
3. Trusting Biased External Sources: When Data Is Manipulated
Behind every free data point lies a commercial bias.
A major strategic mistake is relying on data from external sources that are often biased, manipulated, or difficult to verify.
Common examples include:
-
Advertising platforms (Google Ads, Meta Ads, LinkedIn Ads)
-
SaaS data aggregators (App Stores, customer review platforms, etc.)
-
Third-party benchmarking or audience analysis tools
These platforms often have a vested economic interest in presenting data in a favorable light to encourage increased investment in ads or promotions.
Examples of manipulation include:
-
Impression or click data that includes bots or non-human traffic
-
Displayed conversion rates that ignore bounce rates or attribution errors
-
Search volumes that are rounded or estimated with no transparent methodology
Risks include:
-
Making decisions based on unverifiable data
-
Overestimating the performance of an ad campaign
-
Misallocating marketing or product budgets based on skewed metrics
Best practices to avoid this bias:
-
Always cross-check external data with your own internal data (CRM, analytics, ERP)
-
Evaluate the methodological transparency of the sources used (documentation, definitions, terms of use)
-
Limit strategic decisions that rely solely on external data
-
Favor dashboards that integrate both internal and external data, clearly indicating the source and reliability level
Tip:
Categorize your data sources by their reliability and objectivity. Use a color-coded system in your reports (e.g., reliable, needs verification, unreliable).
Conclusion: SaaS Data Only Has Value When Properly Understood and Contextualized
In a hyper-data-driven SaaS environment, the biggest mistake is believing that more data naturally leads to better decisions.
In reality:
-
Poorly defined data is more dangerous than no data at all
-
Out-of-context data creates a strategic illusion
-
Data biased by external actors can lead to costly, misguided decisions
The key to a successful SaaS data strategy is to foster a critical, high-standards analytical culture:
-
Train teams to interpret data intelligently
-
Document, harmonize, and contextualize every metric
-
Build transparent dashboards that can be challenged and validated
At Saas Advisor, we support our clients in their journey toward analytical maturity, always starting from their unique business specifics rather than relying on market standards.


